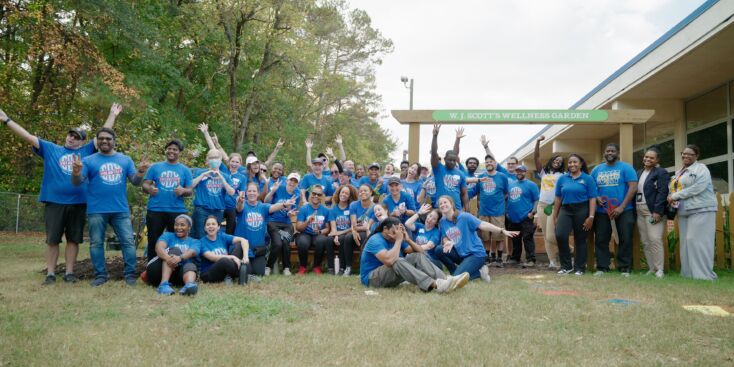
Elementary students can enjoy these engaging STEM lessons during remote learning! Click the table of contents below to “jump” down to your favorite lesson.
Safety First
Before starting these lessons, ask a grown-up if you can go outside and let them know where you plan to be. Get a grown-up’s permission before starting each lesson. You may need to wait for another time to do a lesson safely. Have your grown-up read through this lesson with you and think about the best way to do it. Everyone’s situation is going to be different and that’s okay. Also, look at the supplies list before you begin. We wouldn’t want you to have to come back inside for a pencil or a piece of tape. Have fun learning outside!
Erosion
Parts of a Plant
Plant Adaptations
Weather Data Wind
Charting Weather Data
Erosion
Scientists! Think about these questions:
- What happens to the land when it rains really hard?
- What happens to the land when the wind blows really hard?
- In what ways does the surface of the Earth slowly change over time?
Do some research HERE. Then, go to the next step.
Take another walk around your outdoor space. This time take your journal. Look for signs of erosion in your outdoor space. Draw a map of your outdoor space and note in the drawing potential problem areas of erosion. As another option you could draw and label a diagram of one specific erosion problem. Be sure to label all of your work. As you draw your map or diagram think about the following questions:
- What is causing the erosion? Wind? Rain? Both? Something else?
- What could you do to slow down or stop the effects of erosion?
- What would happen if something was not done to stop the effects of erosion from happening?
- How long do you think it has taken for this to happen?
If you can’t go into your outdoor space or you already know signs of erosion you can use pictures here to help .
Write two paragraphs describing how you would stop or slow down the effects of erosion. Remember both water and wind can cause erosion so there can be multiple solutions to problems. Each solution needs to be tested and compared to other solutions to determine their effectiveness. Also, erosion can happen at different rates over time. Include in your writing the following:
- What materials would you need?
- How would you design it?
- Would your solution slow down or stop the effects of erosion?
- What would happen if you didn’t create a solution?
For Grown-ups
Best Coffee Shops in Manhattan
In this lesson the student will understand that wind and water can change the shape of the land. And that because there is always more than one possible solution to a problem, it is useful to compare and test designs. This lesson will help your student understand that wind and water shape and reshape the earth’s land surface by eroding rock and soil in some areas and depositing them in other areas even in their own surroundings.
After reading over your student’s paragraphs and examining their diagram discuss with them the following questions:
- How is understanding erosion important for people?
- How does wind and water can change the shape of the land?
- What are some places that have been affected by wind and water erosion you know about other than this spot?
- What kind of effects do humans have on erosion? Are they positive or negative effects?
- What types of things can slow down the effects of erosion?
- How might water and wind erosion be different?
Other activities you can have your student do:
- Students can conduct research on erosion.
- They can look for signs of erosion in their neighborhood.
- Build models that show examples of slowing erosion.
- Erosion in a Bottle — Erosion prevention experiment from the Soil Science Society of America
Parts of a Plant
Scientists! Think about these questions:
- What are the parts of the plant?
- What is the function of each plant part you can think of?
Plant “parts” are also called “structures”. In this activity we will use the word “structures” instead of “parts”.
Before going outside, watch this video that talks about HOW TO PULL OUT A WEED using your hands.
Go outside to explore!
- Look for a place where you can find different weeds. There’s a list of common weeds here.
- Carefully, pull out one weed. Be gentle, so you can extract the entire root system.
- Can you identify the different structures of the weed you are observing? (leaves, stem, roots, seeds, flowers)
Go back inside and take the weed with you.
- Open your journal or grab your paper.
- Tape the weed you pulled out to your paper.
- Label each structure of the weed.
For Grown-Ups
This activity will help students to examine the structures of plants and consider how these structures help them survive in the environments where they live. Examples of plants’ structures that support survival, growth, behavior, and reproduction could include thorns, stems, roots and colored petals.
You can show them this VIDEO, that explains the parts of the plant and their functions.
If the student would like to learn more about why weeds adapt so well to almost any environment, watch this VIDEO.
Plant Adaptations
Scientists! Here are some plant facts and questions for you:
- Plants that grow near the forest floor often have large leaves to take in as much sunlight as possible.
- In humid places like rain forests, some plants have leaves with waxy coatings to whisk away water to avoid fungus and bacterial growth.
- What do the plant facts above have in common?
- How do plants meet their needs in different environments?
(Click HERE to see a poster with some examples of adaptations ).
Scientists! Go outside to explore!
If you have a hand lens, take it with you. Here there is a VIDEO that shows you how to use a hand lens.
If you can’t go outside look out the window or think about your school yard.
- Find a plant that interests you. What adaptations can you identify? (Hint: Adaptations are parts of the plant that are structured/built for a specific purpose to help the plant survive.)
- Use your hand lens to observe how each adaptation is structured. What observations can you make about how the adaptations are structured? (for example, a rain forest plant with waxy leaves from the Think and Observe step)
- How do you think the structure of the adaptation helps the plant survive?
Open your journal or grab your paper.
- Draw your plant.
- Label the adaptations.
- Describe the structure of each adaptation with as much detail as possible.
- What function does each adaptation fill to ensure the plant’s survival?
Take a photograph of your plant or your drawing and have a grown-up you trust share your great work with one of our social media channels.
For Grown-ups
This activity will help students explore how plants have different adaptations to help them survive in their habitats. Students will also be prompted to think about the relationship between structure and function. For example, some plants have very thin, shallow roots to capture as much water as they can from Earth’s surface. Other plants have long, thick tap roots that grow deep into the Earth to reach water from below. A common plant with a tap root is the Dandelion. Many other common weeds have very shallow root systems. So, directing your student to pull some different kinds of weeds would be a good way to focus them in on structure and function of roots.
Other activities students can do:
- Seed Dispersal Engineering — Samara Seeds in English and Spanish from Lifelab
Weather Data: Wind
Scientists!
Click HERE to hear a read-aloud of the book: The Windy Day, by Anna Milbourne.
Scientists use evidence to give them clues about nature. Discuss this question with someone at home:
- On a windy day outside, what evidence do you observe that tells you its windy?
Get a plastic bag and go outside to explore.
- Find a stick (shorter that your arm, but longer than your fingers).
- Tie the plastic bag to one end of the stick. (You just made a “windsock”!)
- Find a place to stand and hold your windsock straight up in the air for several minutes.
- Observe your windsock carefully. Do you have evidence that the wind is blowing or not? What is your evidence?
Go back inside.
Open your journal or grab your paper.
Draw a picture that shows the evidence that the wind is blowing. Label your evidence.
Grown-Ups
This activity will help students understand the concept of wind and how wind (moving air). They will think like scientists by looking for evidence and justifying their claims about wind using evidence they collect from observations outdoors. Students will make a simple windsock to help them obtain evidence.
To extend the learning, you can introduce students to the cardinal directions North, South, East, West and they can determine which direction the wind is blowing.
Here is a video that explains more about the wind direction and speed.
This activity will help students to understand that scientists collect and organize data. Then, they analyze and study the data and make comparisons to understand what the data is telling them about the world around them.
To extend the learning experience, have students write greater-than, less-than, and equal-to statements with other sets of data they collect.
Charting Weather Data
For Grown-Ups
In this lesson, students will take temperature readings in the outdoor classroom, compare them to data from a graph, and discuss the numerical differences between the readings and the data.
This lesson provides a hands-on component to link the concept of weather a form of mathematical literacy: reading data. It can be especially interesting on a sunny day in a location where students can take readings from very different spots such as asphalt vs. grass vs. mulch. You may want to use regionally specific temperature graphs or even use several graphs from different regions to cross compare.
Guiding Question:
- Ask your student how the current temperature readings differ from the monthly average temperature on the graph? Lookup your local averages here.
- Inform your student that they will be taking temperature readings outdoors and comparing those readings to a data chart.
- Have your student take temperature readings in different areas.
- Have student compare their readings to data from the graph and calculate the difference.
Questions for students:
- What’s the difference between the “F” and the “C” on thermostat?
- Where do you think would be the coldest/warmest temperatures outside?
- Why do you think there is a difference between the thermometer and the number on the graph?
- How might the temperature change at different times of day? Why?
Ask your student to compile and share their observations. Ask your student what different things can affect the temperature. Discuss the importance of organizing data in a table for scientific studies.
Let your student guess what the temperature readings would be in the different places from the table during a different month of the year and explain why. For example, if a reading from the table stated that the asphalt temperature was 88 degrees in September, a student might guess it would be 78 degrees in October because the air temperature would be cooler but the asphalt would still be warmer than the air temperature. You are simply looking for a logical approach to making a hypothesis.